Calculation details
BET areas
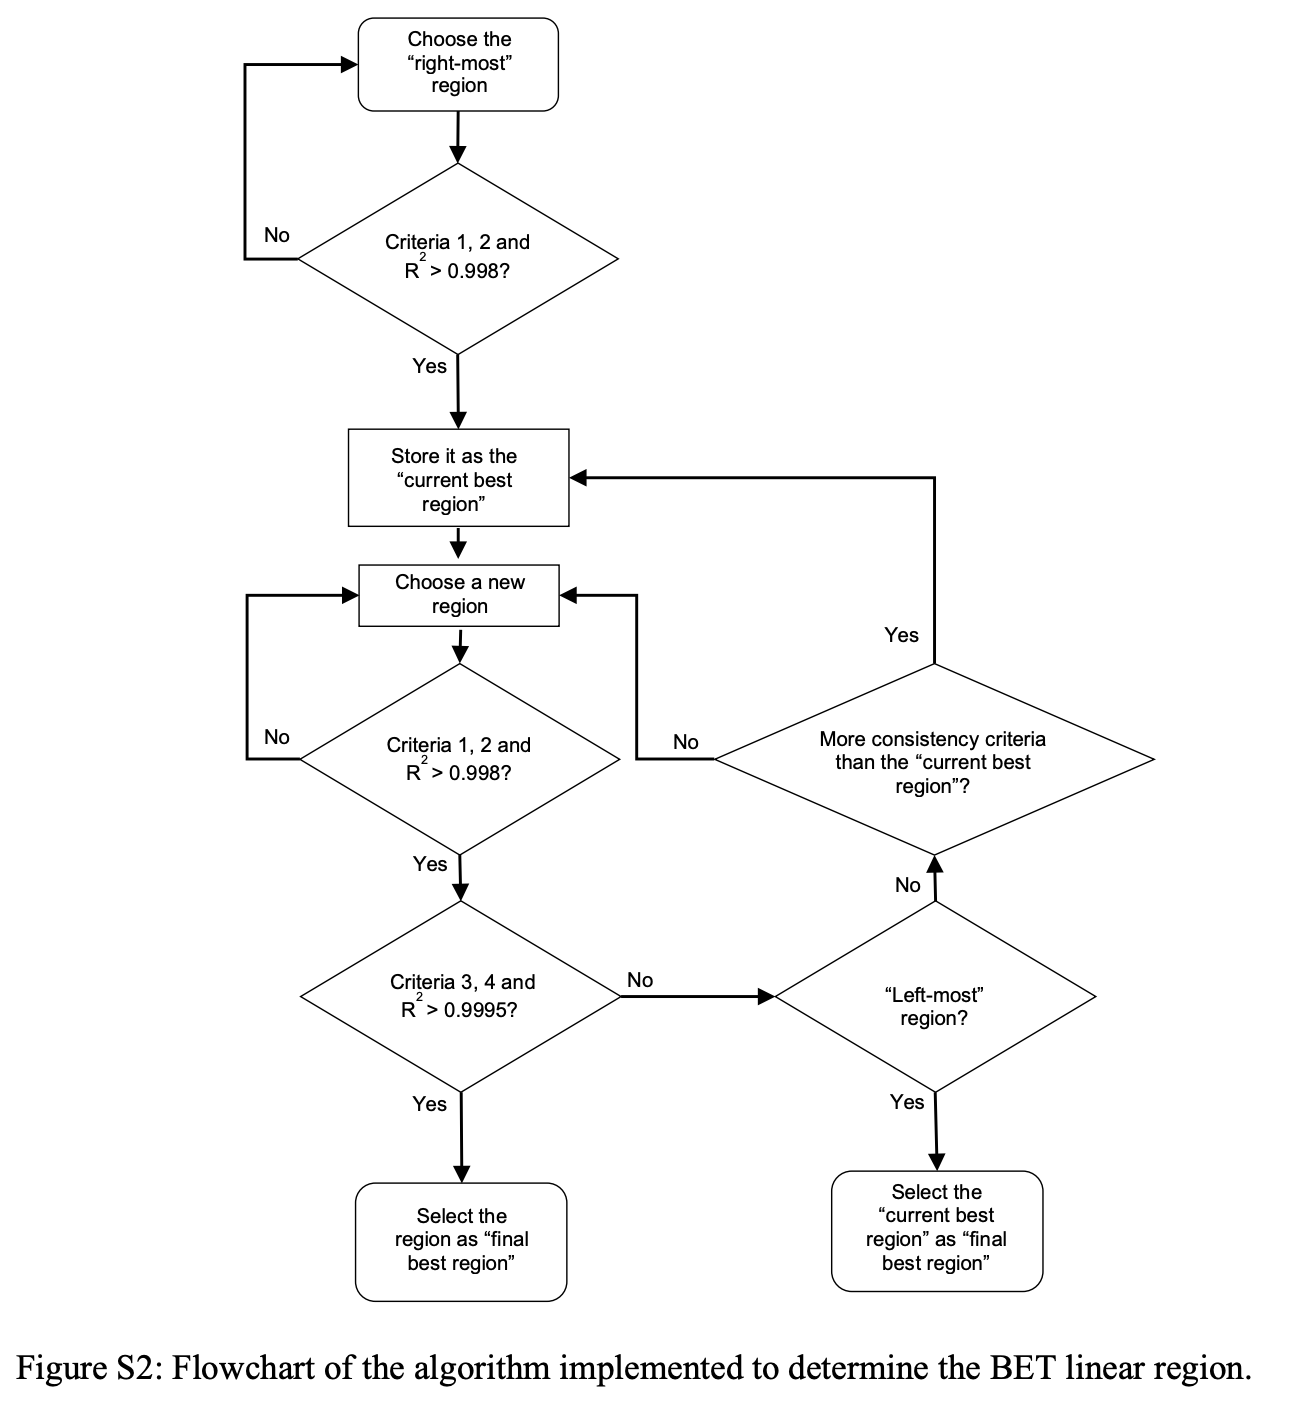
We consider the “right-most” region, which is the region having a high-pressure limit at the point where the first maximum of q(1 − p/p0) with respect to p/p0 occurs (q is the loading, p is the vapor pressure, and p0 is the saturation vapor pressure), as per consistency criterion 1, and a low-pressure limit at the lowest pressure point on the isotherm. Next, we consider a region that has the same upper pressure limit but a lower pressure limit that is shifted to the right by one point on the pressure axis. We continue to move the lower pressure limit to the right until we locate a region with 4 consecutive data points. Then, we shift the upper pressure limit to a smaller value by one point, and again move the lower pressure limit to the right as before until we reach another 4-point linear region. The process continues until we reach a 4-point region starting at the lowest pressure point on the isotherm, which we define as the “left-most” region. We select a linear region to compute the BET area that satisfies as many consistency criteria as possible and contains at least 4 points.Best region for BET area calculation
To select the best region (i.e., the linear region that satisfies the most consistency criteria), we search through all possible “linear” regions. Here, a linear region is a set of 4+ consecutive points having an R2 value greater than 0.998 (or whatever the user has set R2 min to be), and fulfilling consistency criteria 1 and 2. We start with the “right-most” region from the isotherm, and check if it is “linear.” If it is, we store it as the “current best region.” If not, we continue to consider subsequent regions until we find one that is “linear.” Then, we move on to other candidate regions at lower pressures.If a region is not “linear” as judged by R2, it is disregarded. If it is “linear” and satisfies criteria 1 and 2, we check if it satisfies consistency criteria 3 and 4 and has an R2 > 0.9995 (or whatever the user has set R2 cutoff to be). The satisfaction of all these conditions indicates that the region is suitable for BET analysis. If all conditions are satisfied, we choose the current region as the “final best region” and the algorithm ends. If not, we check if the current region satisfies more consistency criteria than the “current best region.” If it does, we replace the “current best region” with the current region. This process is repeated until we reach the “left-most” region. At this point, we end the search by choosing the “current best region” as the “final best region.” The final best region is used to compute the BET area for the structure.
BET + ESW areas
The BET + ESW areas are computed in the same way as the BET areas except that the algorithm is forced to include the first (lowest loading) ESW minimum in the selected region. Thus, the chosen region must satisfy consistency criteria 1 and 2 and have an R2 > 0.998, and include the relative pressure corresponding to the first ESW minimum point. The correct calculation of the BET + ESW areas depends on the correct identification of the ESW minimum. If the ESW minimum is wrongly identified, the BET + ESW area will also be wrong. Thus, we recommend that users ensure that the first minimum is correctly identified.ML approach
The machine learning areas are computed using a Lasso linear regression model that takes as input the mean loading values of seven logarithmically divided pressure subregions. The model is trained on GCMC-calculated argon isotherms at 87 K. For more information, see Beyond the BET Analysis: The Surface Area Prediction of Nanoporous Materials Using a Machine Learning Method.References
- Surface Area Determination of Porous Materials Using the Brunauer–Emmett–Teller (BET) Method: Limitations and Improvements, J. Phys. Chem. C 2019, 123, 33, 20195 - 20209
- Beyond the BET Analysis: The Surface Area Prediction of Nanoporous Materials Using a Machine Learning Method, J. Phys. Chem. Lett. 2020, 11, 14, 5412 - 5417